Notes:
All amounts in New Zealand dollars ($NZ) unless otherwise stated.
Previous analysis of this company includes the annual accounts to 1.8.21 and the interim accounts to 1.2.22.
Preliminary FY22 analysis as the annual report 2022 is not yet available.
Trading History
Source: Direct Broking
Key Issues
Falling $NZ value against $US.
High dividend payout ratio but no imputation credits on final dividend
Falling EBIT & EPS decline
Revenue includes government grants
5,432 trading days lost in first half of FY22
Very poor New Zealand performance
Overview
Hallenstein Glasson Holdings Limited (HLG) is an NZX-registered company that retails clothing in multiple business segments. These are Glassons Australia Limited, Glassons Limited in New Zealand and Hallenstein Bros Limited in New Zealand and Hallenstein Brothers Australia Limited.
It also has a New Zealand property-owning subsidiary through Hallenstein Properties Limited.
The company has generally come through the Covid period well retaining its profitability with positive operating cash flow and dividend continuity.
Glasson Australia has been the outstanding performer.
The company published a very readable set of financial statements for FY22.
There are not many items that require recasting in such a straightforward set of accounts.
Accounting Policies
Historical cost convention has been used but land & buildings and financial assets & liabilities have been assessed at fair value.
Operating land & buildings have been tested for impairment. The values are determined by the Board and independent valuations are done every three years.
Investment land & buildings are subject to annual independent valuations.
Businesses in other currencies are consolidated at the balance date values in $NZ. Income and expenses are consolidated at average exchange rates but the financial statements don’t state whether this is over the whole year, monthly or by some other method.
Auditor’s Report
The financial accounts were audited by PwC; a large international accounting firm. They raised a single key audit matter which concerned inventory valuation.
Inventory book value is the lower of cost and net realisable value. This is a question of judgement which is made by management.
The auditors set a materiality threshold for their audit at $1.75m which was 5% of consolidated net profit.
Directorships
During FY22 a single non-executive director retired reportedly due to other work commitments. A single director also retired in the previous year.
Management
The roles of Chairman of the Board and CEO are separate which is a good thing and a new CEO was recently appointed.
Related Party Transactions
One of the key shareholders receives a significant amount of rental payments from the company.
Recast Revenue Statement
Revenue Summary:
*EBIT has been adjusted here to include finance income. The reason is that a better calculation of funding cost cover can be produced when all revenue is taken into account.
Revenue:
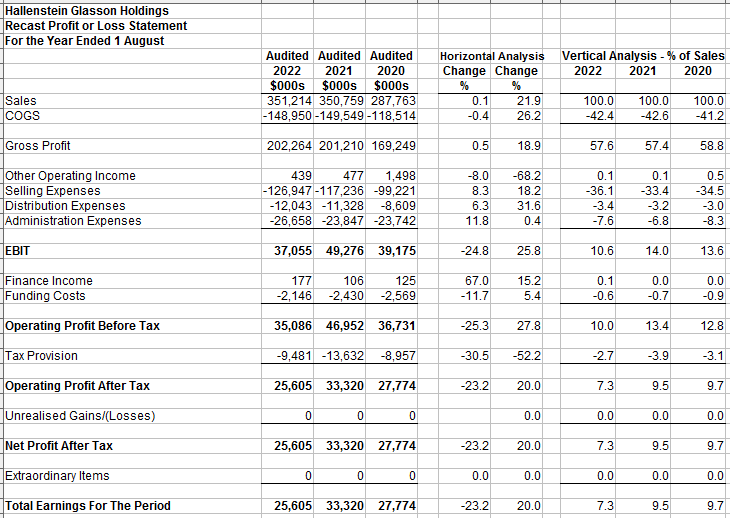
Total earnings for the year were down 23.2% at $25.6m.
Selling expenses increased by 8.3% to $127.0m while distribution and administration expenses increased by 6.3% and 8.3% respectively. All of these operating expense items increased much faster than sales leading to a decline in EBIT by 24.8% to $37.1m.
Recast Balance Sheet
Total assets regained the $200.0m level it exceeded two years previously and finished the year at $205.2m.
It’s refreshing and relatively rare to see a company with so little in the way of intangibles on its balance sheet.
Contingent liabilites were only 0.6% of total assets.
ROU liabilities exceed ROU assets by over $10m; a massive $24.3 depreciation charge on leased assets was made in the current year.
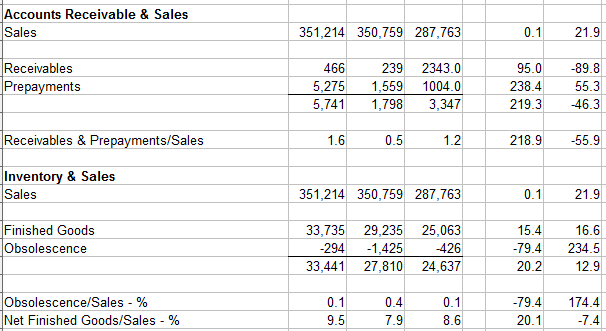
The company has increased inventories by 20.2% YoY. But interestingly, the obsolesence impairment charge fell by 79.4% to only 0.1% of sales. A very good result which shows excellent buying patterns if proved accurate.
Receivables & prepayments are up by 219.3% and the notes to the financial statements do not say why. Prepayments make up the lion’s share of this increase. Hopefully when the annual report comes out this issue will be addressed.
Recast Movements In Equity
Shareholders’ funds increased by only 1.5% to $90.5m. The dividend payment of $25.1m swallowed nearly all of the total earnings of $25.6m.
Recast Cash Flow Statement
Direct Method:
Dividends paid are included in operating cash flow. Even with the inclusion of dividends paid the operating cash flow is up by 12.2% on the previous period. This is a result of reduced dividends paid in the period which offset the declining surplus of receipts over payments.
Indirect Method:
Closing cash was down on the previous year by 10.4% at $35.1m. The gap between reported total earnings and the change in cash for the period has reduced from $43.7m to $29.7m which is a positive sign.
Cash fixed asset purchases increased by 5.0% to $8.3m.
The company has slowed its payments to creditors which saved $2.9m of cash outflow. But receivables cash outlays have increased as have those of inventories.
Cash Flow Pattern:
The company has a typical cash flow pattern of companies that are well established. It has a positive operating cash flow which is used for further investment and the reduction of financing liabilities. There was $8.3m of fixed asset purchases and lease liabilities were reduced by $23.8m.
Ratio Analysis
The company has an EPS of 42.9 cents for the FY22 period which lead to a P/E ratio at the balance date share price of $5.35 of 16.9 times.
Dividends:
The dividend yield was 8.5% at the balance date share price.
The dividend payout ratio is nearly the whole of total earnings in FY22 and exceeded total earnings in FY21.
In the more normal (mostly pre-Covid) period of FY20 the payout ratio was 51.5%.
Segmental Analysis
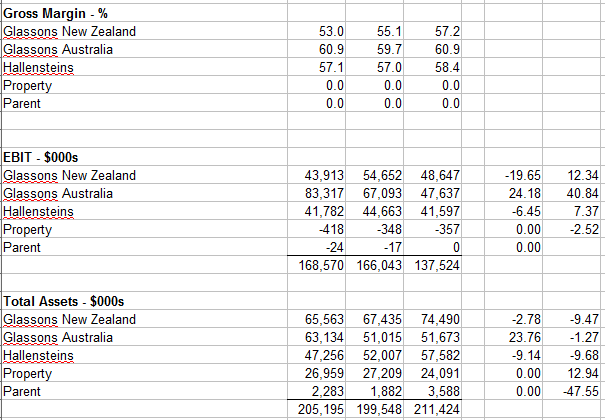
The company provides an admirable amount of information on its segmental activities. This enables quite useful metrics to be calculated for each business segment.
Glassons Australia was the stand out performer for the Group recording a NPAT to equity ratio of 88.7%. It had an EBIT of $83.3m which nearly made up half of the group EBIT.
Hallensteins did poorly recording a 7.3% fall in gross profit to $51.3m although its gross margin held up reasonably steady.
Forecast Issues
The forecast for this company is not easy to make. Although sales have surged back from their Covid-related fall the $US has increased in value against the the $NZ.
Source: Google Finance
For the bulk of FY22 the $NZ was above 0.65 cents US and a year ago it was over 70 cents US. It is fair to say the $NZ has collapsed against the $US which could also currently be said of many currencies.
Summary
Hallenstein Glasson Holdings is a financially sound company which has done relatively well through the Covid period.
The question must be asked however, why does the company pay such high dividends when Glasson Australia is returning such enormous profits for the Group? Wouldn’t part of the dividend money be better deployed in expanding the Glasson Australia business rather than paying it to shareholders?
The dividend payouts over the last two years have been very high presumably because the company does not want to cut dividends by too much and affect the share price too badly. However, an explanation to shareholders of the potential gains from investing in Glasson Australia could be made.
There is also room to take on debt to make the Australian expansion (without reducing the dividend by too much). There is currently no interest bearing debt on the balance sheet although there is a significant amount of ROU liabilities.
Funding cost cover based on adjusted EBIT is superb at 17.3 times which gives plenty of latitude for debt raising and the equity ratio provides some wiggle room.
The annual report when available will hopefully address these and other issues.


It's horrible trying to value stocks at the moment, with the threat of the economy turning and the ocr increasing which makes the free cash rate higher, increasing the discount required in DCF valuations and altering what is an appropriate PE... All the while with the possibility of a resistant economy and company reports with positive results pushing valuations in the other direction.
It's nice to read analysis from other nz investors to see how others ate handling it at the moment. Thanks for sharing.