Two Year Trading History
Key Points:
No borrowings
Improving equity ratio at 47.9%
Reductions in ROU liabilities & assets
Reduced interim dividend
EBIT decline of 39.0%
Total earnings down 40.0% to $11.9 mn
Positive operating cash flow
Excellent funding cost cover of 17.6 times
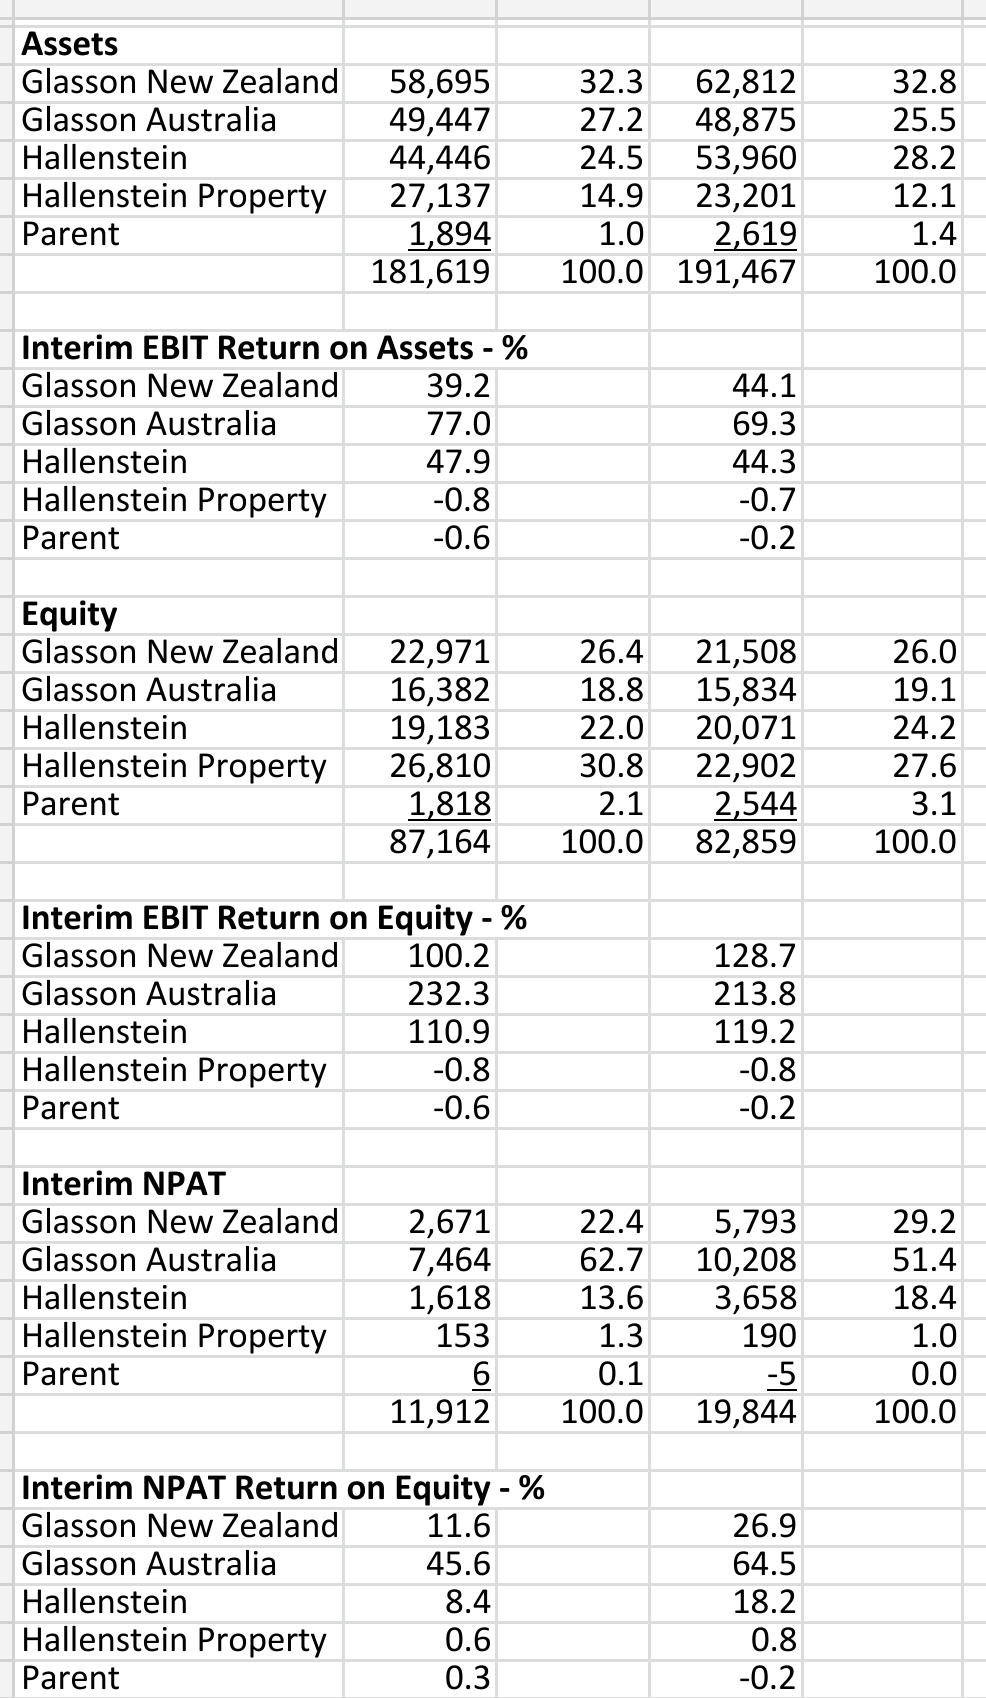
Glasson Australia provides 62.7% of NPAT
Overview
Our last look at this company was the annual accounts to 1.8.21 which were posted here on 8.4.22.
This analysis is for the latest interim accounts which cover the six months ended 1.2.22.
Hallenstein Glasson Holdings is listed on the NZX under the code HLG.
The company has four main operating divisions which include Glasson New Zealand, Glasson Australia, Hallenstein and Hallenstein Property.
Hallenstein and the two Glasson divisions have increasingly important online businesses.
One of the interesting things about this company is that its best performing division is Glasson Australia. It's often a real struggle for New Zealand public companies to do well in Australia but this company seems to have found a way to make money there.
Revenue Statement
Key Points:
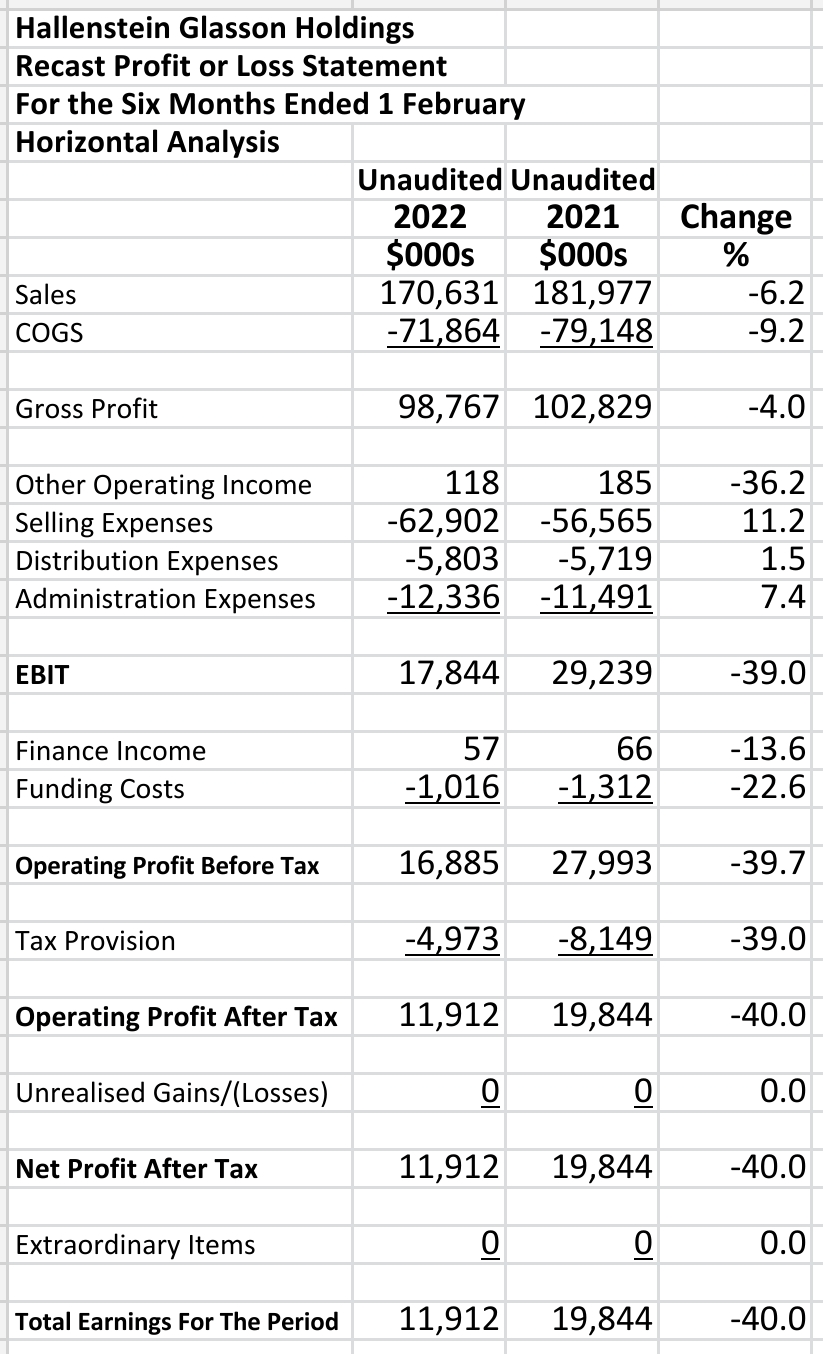
Sales down 6.2% to $170.6 mn
EBIT down 39.0% to $17.8 mn
Total earnings down 40.0% to $11.9 mn
EBIT/sales is down from 16.1% to 10.5%
Selling expenses/sales has risen to 36.8% from 31.1%
Occupancy costs are up 12.3%
Wages and benefits (including government grants passed on) are up 7.6%
Horizontal Analysis:
Vertical Analysis:
Sales declined but the company was able to reduce the cost of goods sold (COGS) by a greater percentage which held the decline in gross profit to 4.0% at $98.8 mn.
Selling expenses and to a lesser extent administration expenses were significantly higher at 11.2% and 7.4% respectively.
These are important increases in expenses and show some stress on these aspects of the business.
Total earnings/sales declined from 10.9% to 7.0% at $11.9 mn.
Wages and benefits and occupancy costs are up by 7.6% and 12.3% respectively
The company seems to be experiencing inflationary pressure on multiple aspects of its business.
Unfortunately, the company does not publish any same store sales (SSS) data for its interim accounts.
This is one of the most important metrics for retail businesses and it would be very helpful if these figures were published.
Balance Sheet
Key Points:
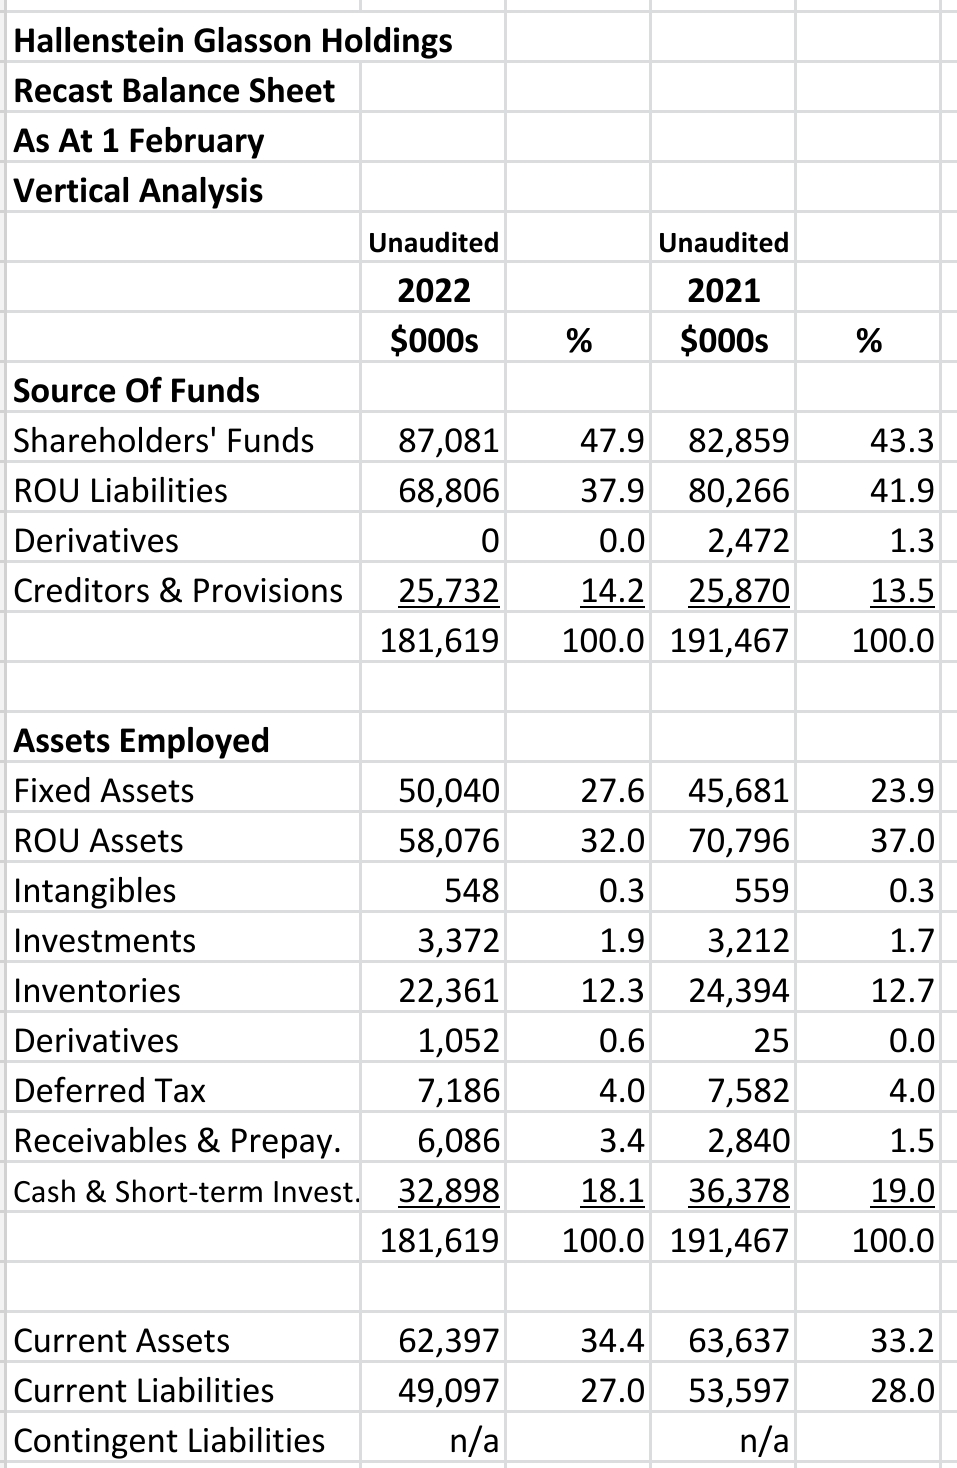
ROU liabilities declined 14.3% to $68.8 mn
ROU assets reduced 18.0% to $58.1 mn
Shareholders' funds up 5.1% to $87.1 mn
Inventories down 8.3% to $22.4 mn
Contingent liabilities were not reported
Cash down 9.6% to $32.9 mn
Fixed assets up 9.5% to $50.0 mn
No borrowings
Horizontal Analysis:
Vertical Analysis:
Movements in Equity
Key Points:
Negative retained earnings of $2.3 mn for the latest period
Increase in shareholders' funds of 5.1%
A significant revaluation (not shown) in the intervening period accounts for most of shareholders' funds increase
’
Cash Flow Statement
Key Points:
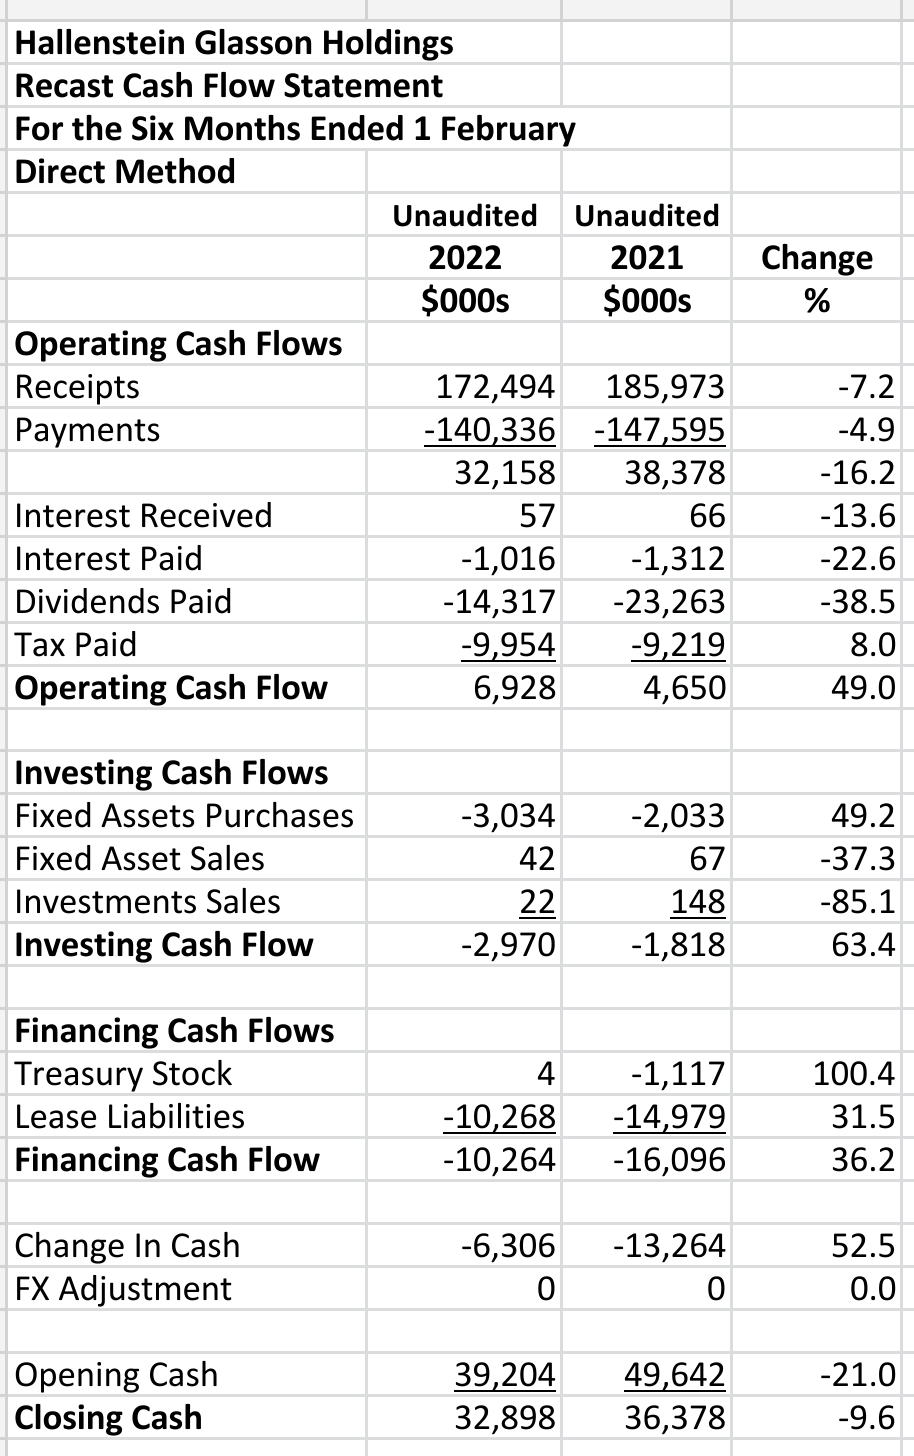
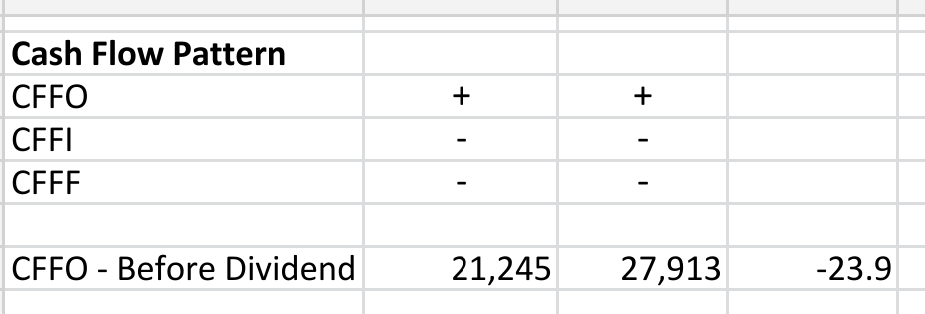
Positive operating cash flows from operations in both periods even after dividends
Cash flow pattern shows investment in fixed assets and reduction in ROU liabilities
Direct Method:
Indirect Method:
Ratios
Key Points:
Improving equity ratio at 47.9%
High funding cost cover of 17.6 times
Interim dividend yield of 2.99%
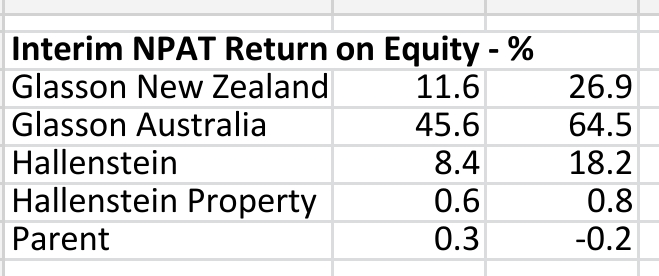
High returns on equity
Segments
Key Points:
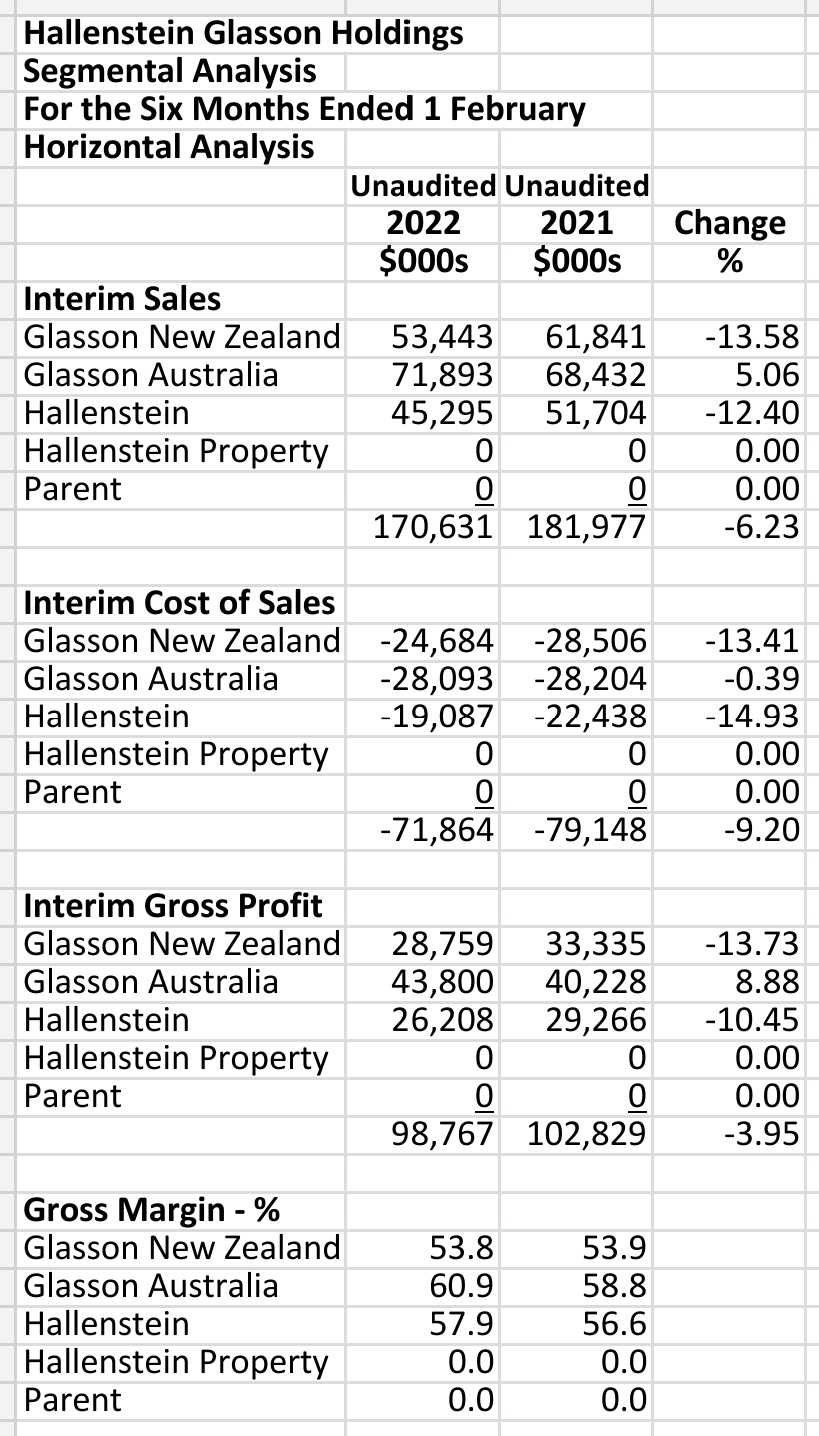
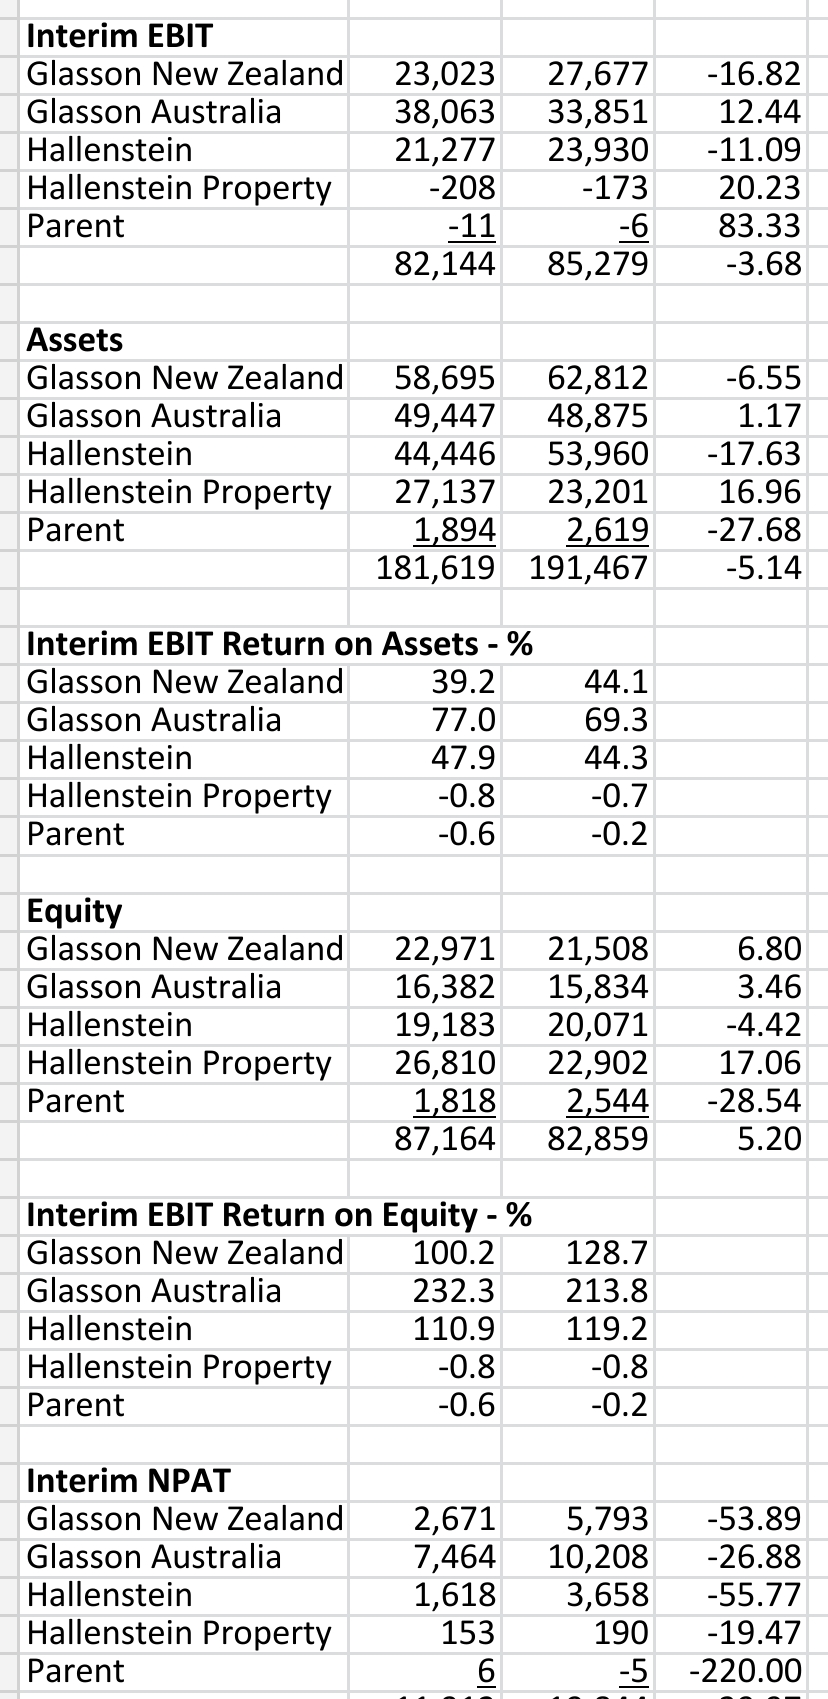
Glasson Australia is the only segment with higher sales, rising gross profit and rising EBIT
NPAT is down across all segments
Glasson makes 62.7% of company NPAT
Horizontal Analysis:
Vertical Analysis:
Summary
The company experienced many loss of trading days lost during both periods.
The trading day losses should be much fewer in the future and sales will increase accordingly.
The company is profitable with no borrowings, good operating cash flows and dividends.
Dividends, however have fallen significantly in the latest period.
The company makes high returns both on assets and equity.
It also has plenty of cash & short-term investments on hand at balance date.
Glasson Australia has become the most important segment of the business.


