Update: Auckland International Airport (AIA.NZX, AIA.ASX)
Annual Accounts to 30th June, 2022 (Three Year Analysis)
Notes
All amounts in New Zealand dollars ($NZ) unless otherwise stated.
The ‘key numbers’ from the 2022 Annual Report are shown below:
Overview
Auckland International Airport (AIA) is an airport owner and operator in Auckland, New Zealand which has essentially a monopoly on air travel services in New Zealand’s biggest city.
It’s listed on both the NZX and the ASX under the code AIA. It also has bond securities listed on the NZX under the codes AIA200.NZX, AIA210.NZX, AIA220.NZX, AIA230.NZX & AIA240.NZX.
It had a particulary hard time of Covid-19 and is now emerging from the constraints placed on the borders by the (over-)? zealous New Zealand government.
It’s recently made most of its money through real estate and property, plant & equipment (PP&E) revaluations and not so much through its actual operations.
The accounts were restated for the June 2021 year in the 2022 Annual & Financial Reports.
Previous coverage of this company can be found at the Annuals to 30.6.21 and the Interims to 31.12.21.
Recast Statement of Profit & Loss
The company’s accounts are abnormal because of the Covid-19 situation. However, be that as it may, EBIT for FY22 is low (as it was in FY21) at $38.3m compared to FY20 when it was $265.2m (when 1/4 of the period was in Covid-19).
Revenue is up 6.8% YoY but still way behind the $567.0m recorded in FY20.
Funding costs are net of the finance income amount as finance income was low.
Operating profit after tax is distorted somewhat by a tax credit in FY22 but is effectively the underlying earnings for the company. They are only $6.6m in FY22 which is, however, a significant improvement on FY21’s -$90.7m.
Once again, investment property revaluations are much greater than the operating profit after tax and represent the vast majority of the company’s total earnings.
Total earnings were down by 58.9% from FY21 to $191.6m.
Recast Statement of Financial Position
The company has a high equity ratio of 80.3% which has been achieved on not only core earnings but property and PP&E revaluations.
It’s got relatively low debt compared to many companies and no ROU assets or lease liabilities. Current liabilities are much larger than current assets though.
Of some concern is the 68.9% decline in cash & short-term investments which closed FY22 at $24.7m. However, the low gearing of the balance sheet and the abnormal trading conditions give comfort in this regard.
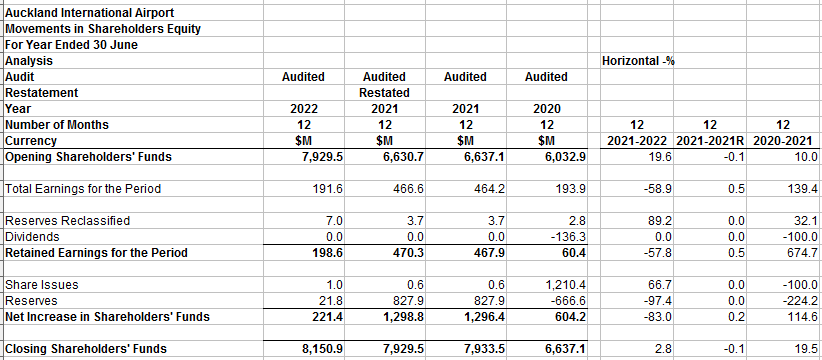
Recast Movements in Shareholders Equity
The capital raising of $1.21bn in FY20 stabilised the company in the troubled Covid-19 period. Shareholders’ funds were up 2.8% to $8,150.9m at the end of FY22 from FY21.
Recash Cash Flow Statement
Direct Method:
Operating cash flow has held up well over the last couple of years as no dividend has been paid and the company down-scaled its operations. Dividends paid are recorded in operating cash flow.
It has continued to invest in fixed asset purchases but not nearly at FY20’s level.
The large capital raising in FY20 gave it the ability to pay down some debt in FY21, but it incurred more debt in FY22.
Indirect Method:
There was little movement in working capital over the last two years.
Ratio Analysis
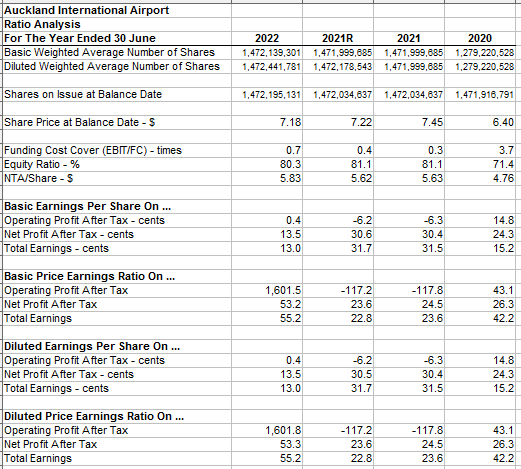
Earnings per share (EPS) on the operating profit after tax (underlying earnings) is negligible at 0.4 cents but rises on total earnings EPS to 13.0 cents yielding a P/E ratio of a very high 55.2 cents per share at balance date in FY22.
Funding cost cover was poor at 0.7 in FY22. There is not currently enough money produced by EBIT to cover funding costs.
Free cash flow is very poor at -$163.8m and has been negative for the last three years. The company is not producing enough operating cash flow to cover its capital expenses (capex) requirements.
Segmental Analysis
The company doesn’t provide enough information to adequately analyse segments. All that can be said is that passenger service charges, retail and rentals have made a comeback from FY21 to FY22.
Summary
AIA is a monopoly business that has been hit hard by Covid-19 over what was, in hindsight, a draconian response by the New Zealand government across the country but specifically at the borders.
As international & domestic travel and cargo ramps up AIA is recovering but only to some degree at this stage.
As interest rates rise AIA is not so much exposed on its interest bearing debt. Its interest bearing debt has significant bond components and the coupons are locked in.
Its interest rate exposure is at the property and PP&E reserves level because of the massive revaluations it holds in its reserves. Some of these may be reversed and run through the revenue statement in the future if the central bank raises rates quickly.
The company’s underlying earnings are still poor as can be expected at this stage of its recovery.
Low debt, positive operating cash flow and non-payment of, or low dividends will hopefully see the company through what is left of the recovery phase.
Funding cost cover remains very poor.
Free cash flow (FCF) remains very much a concern. On the one hand it is good to see the business maintaining assets but on the other hand it has running negative FCF for the last three years.
The company is a recovery story and is reasonably well positioned financially to weather the period required (whatever that may be) to get back to normal operations.
Its market capitalisation (at balance date) of $10.57bn reflects the market’s belief in both the quality of the company and its chances of a full recovery.


