Notes:
All amounts in New Zealand dollars unless otherwise stated.
The company’s interim accounts to 31.1.22 were discussed previously here.
Key Points
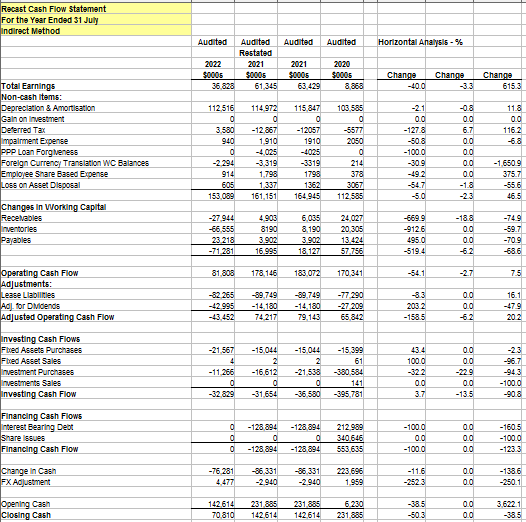
Large negative cash flow from operations using recasting methods
Gross margin held
High level of intangibles to total assets
Change of auditor
Kathmandu CEO departure
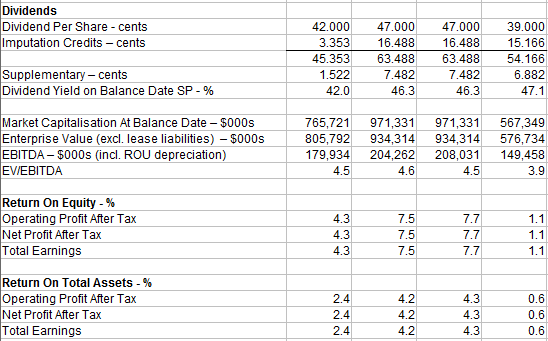
Dividend payment exceeds total earnings
All brands have reduced EBIT YoY
Foreign exchange translation gains improved equity
Cash & cash equivalents are down by half
High historical P/E ratio
High freight prices
Trading History
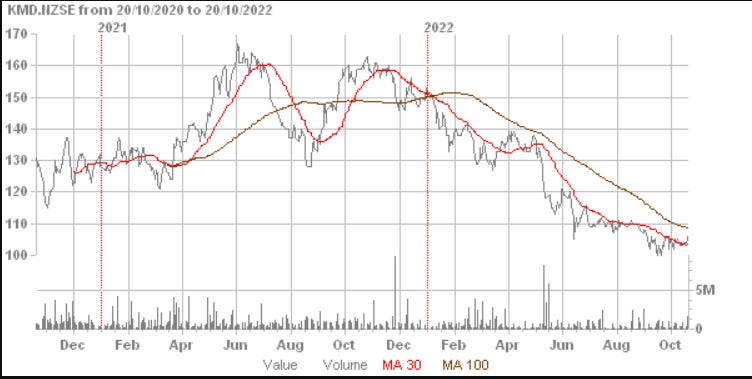
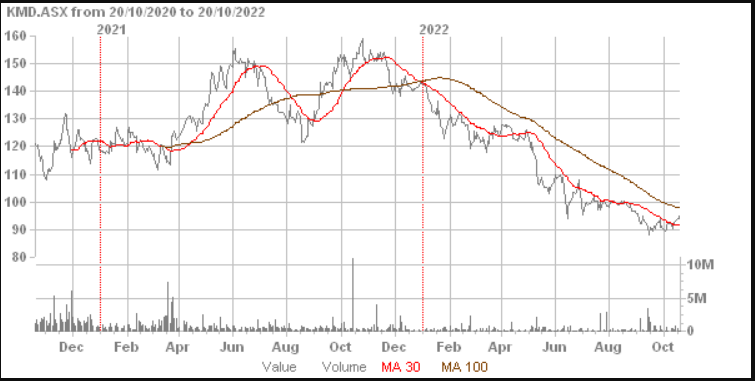
KMD is listed on both the ASX and NZX under the code KMD.
NZX:
Source: Direct Broking
ASX:
Source: Direct Broking
Overview
KMD Brands (KMD) is an international group which calls itself “a global outdoor lifestyle and sports company.”
It owns three brands; Kathmandu, Rip Curl and Oboz.
Kathmandu was founded in 1987 in New Zealand and sold travel and adventure equipment. Kathmandu produces 19% of sales online while 81% of sales are made in retail stores.
Oboz joined KMD in 2018 but is based in the United States. It designs outdoor footwear. Oboz produces 2% of sales online while 98% of sales are made in retail stores.
Rip Curl was acquired in 2019 and it sells surf equipment. It was founded in Australia in 1969. Rip Curl sell through a mixture of retail stores, online and wholesale.
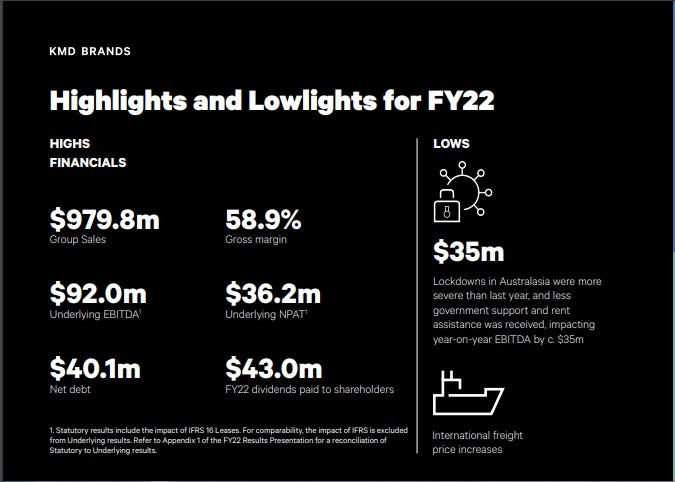
The company published the following highlights and lowlights in its annual report:
Source: KMD Brands Annual Integrated Report 2022
Auditor’s Report
The auditor was replaced during the financial year. KPMG took over from PwC and issued a clean opinion for the Group’s financial statements. Notably, both firms are large and well-known.
This may be a significant issue and it is not usual to change auditors because of the steep and costly learning curve of the new audit team. Often replacement occurs because of disagreements with financial statement presentations.
The company has an Audit and Risk Committee.
KPMG set its materiality level based on revenue of $4.1m.
The auditors identified some key audit matters including the difficulty of estimating the level of intangibles. This is especially significant given than intangibles make up 46.3% of total assets. The auditors ran a series of impairment tests to determine the validity of the asset values.
The business was broken down into cash generating units (CGUs). These were assessed both in the past and into the future. Terminal growth rates and discount rates are a matter of judgement. There is always uncertainty around whether the rates are valid and independent expertise was employed by the audit team to establish those figures.
The auditors also identified an issue around software as a service (SaaS). A degree of certainty was obtained through the auditor’s sampling process they maintained.
Accounting Policies
Foreign currency translation is a significant item because of a material amount recorded in reserves for FY22 which affects the equity ratio published by the company.
As the New Zealand dollar has fallen there have been gains registered in foreign held balance sheet items.
Also income and expenses changed as the New Zealand dollar fell.
Foreign Currency Translation Effects:
Foreign currency translation figures are recorded by the company on offshore assets and liabilities values at the relevant balance date. For revenue statement items an average of foreign currency values is recorded. The interval is not stated.
These foreign currency translations are taken to reserves in the foreign currency translation reserve account.
These entries can have a significant effect on the equity ratios of the Group.
Directorship
There are seven directors of the company and all but one of them are non-executive directors. This is assuming the Chairman David Kirk is not an executive.
Management
The CEO of Kathmandu, Reuben Casey departed during FY22 and has not yet been replaced with the Group CEO filling the interim role.
The group’s legal counsel, Tony Roberts also left at the end of FY22.
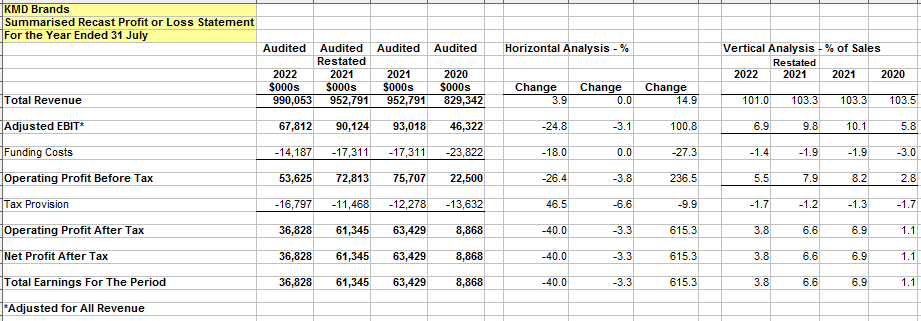
Recast Revenue
The financial statements for the previous period are restated. This is because of changes to the way that Software-as-a-Service is treated.
First Iteration:
This first iteration puts all revenue and income no matter the source into total revenue.
Second Iteration:
The second iteration is more conventional but unusual in that there are no extraordinary or unrealised items recorded in the year.
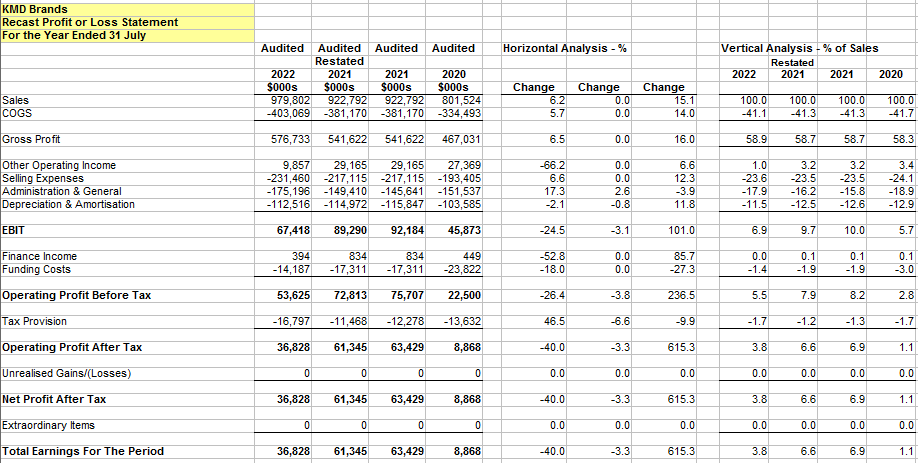
Sales rose 6.2% producing a gross profit up 6.5% to $576.7m. Despite the freight and Covid-19 issues the gross margin increased slightly to 58.9% which may bode quite well for the future when shipping and Covid-19 are normalised and ended respectively.
Administration & general expenses rose by 17.3% to $175.2m.
The NPAT was down a whopping 40.0% at $36.8m as was the total earnings.
The company draws attention to its EBITDA and underlying EBITDA but these metrics are not used here.
Recast Balance Sheet
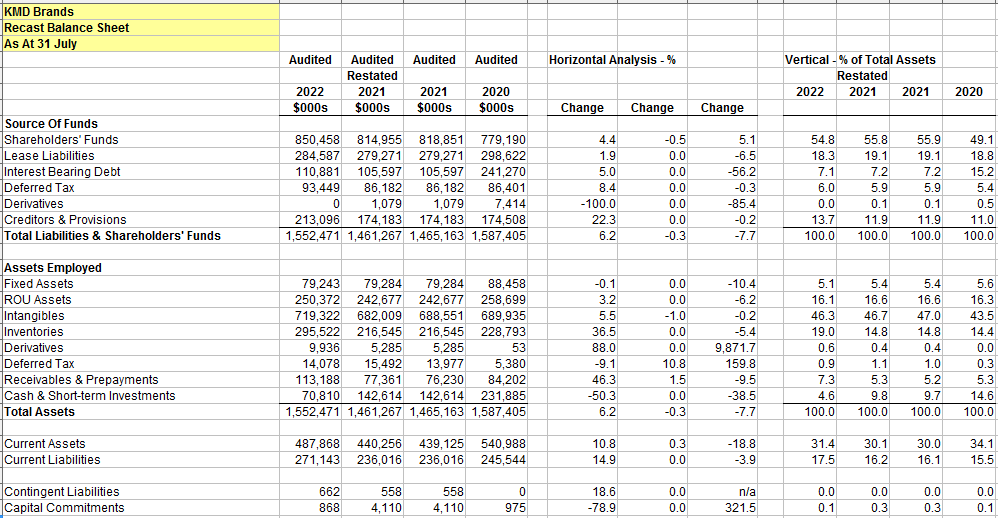
The equity ratio dropped slightly to 54.8% which is a good percentage. However, it must be viewed in light of the very high level of intangibles; goodwill and brand values, compared to total assets.
There is a degree of uncertainty surrounding what the future holds for interest rates, discount rates and terminal growth rates. These are part of the mathematical basis on which intangible and brand values are calculated.
Significant movements up in interest rates would materially affect the carrying amounts for intangibles and brands. Interest rates are rising globally.
There could well be impairments in the future which will impact both profits and equity ratios.
There has been an increase of receivables to sales which was at 11.8% on a 46.3% increase in receivables. The company is not getting paid as quickly as it should and there may have been terms offered accordingly to get the sales.
Inventory was up by a very significant 35.8% to $295.5m or 30.2% of annual sales as against 23.5% of total sales the previous year.
Recast Movements In Equity
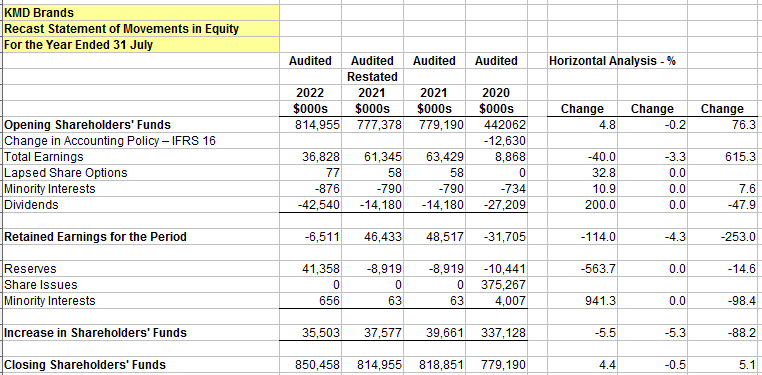
Total shareholders’ equity increases by 4.4% to $850.5m. There was a very generous dividend paid of $42.5m which was higher than the total earnings for the year.
Also, the reserves, specifically the foreign currency translation reserve lead to an increase in shareholders funds despite the payment of the very large dividend.
Recast Cash Flows
In the recast statement of cash flows lease liabilities which comprise both interest and liability reduction components are treated as an operating cash flow item.
This treatment along with placing the dividends paid in the operating cash flow section radically changes the net operating cash flow figures for the last three years.
One of the reasons IFRS 16 was brought in was that often assets and liabilities were hidden off-balance sheet. This distorted equity ratios.
But this treatment resulted in lease liability payments being recorded as a financing item in the cash flow statement thereby raising operating cash flow unreasonably.
The solution is to move the lease liabilities to operating cash flow while recording the lease liability and right-of-use assets in the balance sheet.
Placing lease liability payments in operating cash flow gives a much more accurate picture of the company’s operations. Some explanations can be found here.
Direct Method:
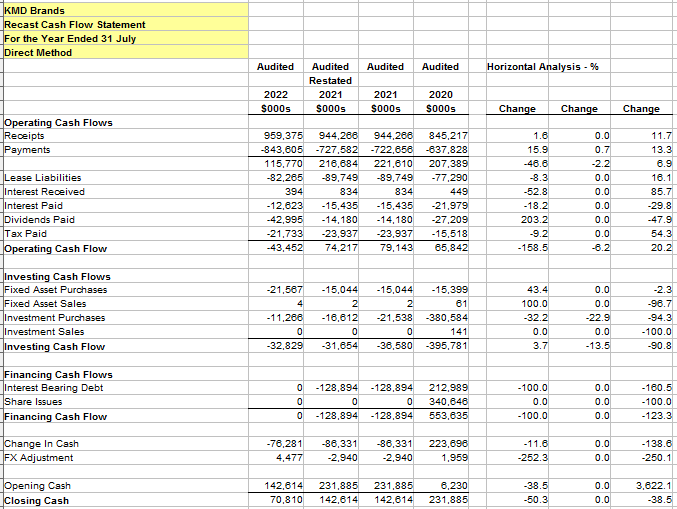
The operating cash flow is -$43.5m which is a poor result given that the previous two years showed positive figures.
The company has been expanding but the difference between receipts and payments are down a massive 46.6% in FY22.
The company has been burning cash in the last two years paying off some debt, investing and purchasing fixed assets. In FY21 its cash & cash equivalents dropped $86.3m and in FY22 this figure was $76.3m.
Indirect Method:
The changes in working capital show the slowing of payments to suppliers, the large increase in inventories and the slowing receipts from customers. These items produced a -$71.3 change in working capital in FY22.
Cash Flow Pattern:
The cash flow pattern in prior years shows a typically established company using its surplus cash flow to invest and repay debt.
However, in FY22 the company achieves the cash flow pattern of a start-up, early stage or fast expanding company in running negative operating cash flow.
Ratios
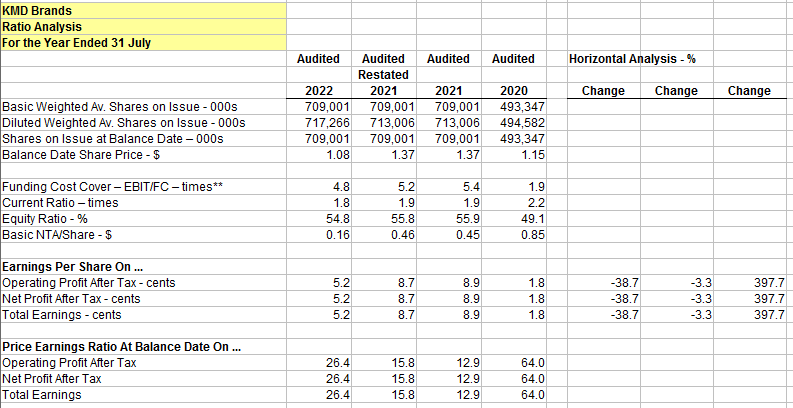
The company recorded an EPS of 5.2 cents per share in FY22 based on total earnings. This put it on a historical P/E ratio of 26.4 on the balance date share price of $1.08. This EPS was down 38.7% on the previous year.
The company didn’t provide a lot of imputation credits in FY22 but the raw dividend was massive.
The company’s return on equity and return on total assets were poor at 4.3% and 2.4% respectively. The return on equity is hardly better than a bank deposit.
Market capitalisation for the FY22 balance date had fallen from the previous balance date by circa $205m.
Segments
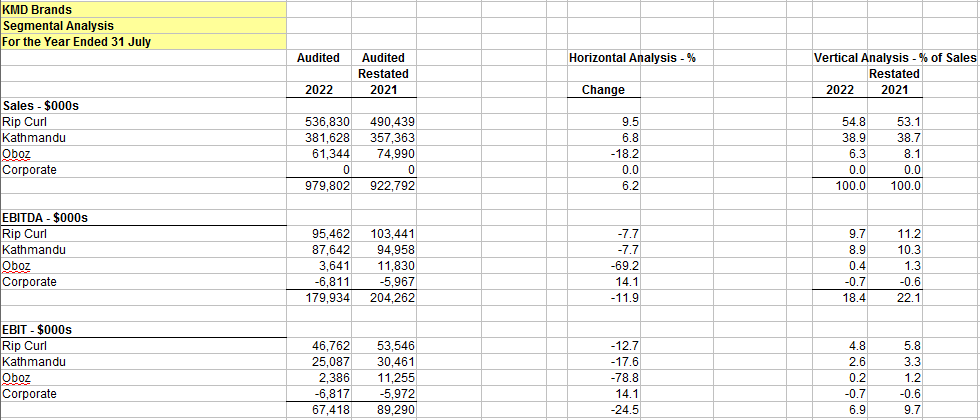
There are three businesses within the KMD Group. In the FY21 financial statements the segmentation is not consistent with the FY22 financial statements and is omitted.
EBIT was down in every business segment. Oboz was the worst at $2.4m while Rip Curl was the best at $46.8m. Kathmandu sales were up but it didn’t translate to EBIT gains.
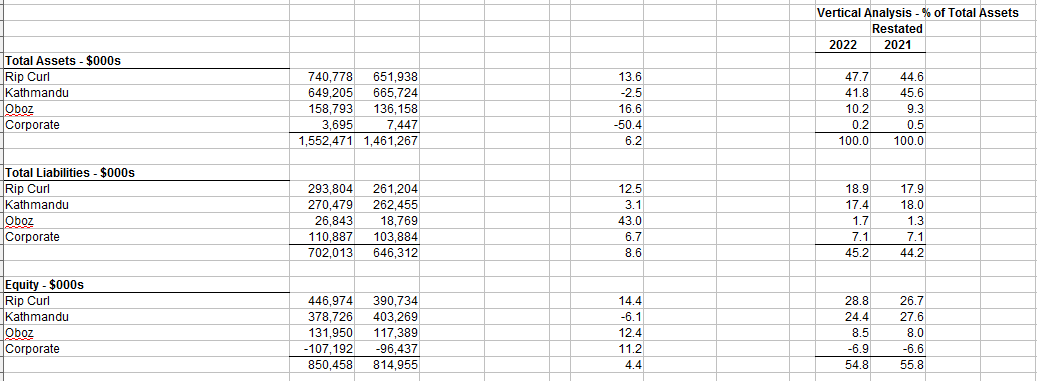
Kathmandu is fading slightly in both equity and total assets while Ooz and Rip Curl are growing.
It’s nice to see corporate assets declining.
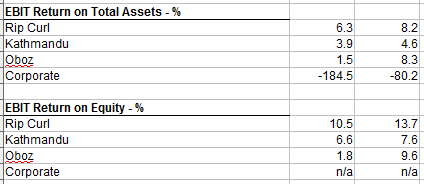
Rip Curl has the best EBIT return on equity at 10.5% while Oboz has the poorest at 1.8. None of these are particularly impressive.
Outlook
The KMD results have been positively spun in a Fashion Network article on 21st September, 2022 titled KMD Brands posts record sales on strong Kathmandu, Rip Curl revenues.
The revenue was the only increasing metric. Further down the article the declining EBITDA was referenced and blamed on Covid.
CEO and managing director, Michael Daly is quoted as saying, “KMD Brands is well positioned to deliver continued sales and earnings growth in FY23.”
Earnings growth in FY23 is not continuing because the change in FY22 was a decline.
The falling New Zealand dollar helped the company’s balance sheet producing significant foreign currency translation gains for FY22. At these dollar levels there may be a possibility of those gains which are placed in the foreign currency translation reserve reversing out in the next financial year or beyond.
Likewise, the extra revenue from translating revenue items back to the New Zealand dollar would have had a positive impact on the results.
Rising interest rates will also affect profits in the future and there are no guarantees how far rates will rise. Already there are extremely concerning reports coming out of the United States and the United Kingdom on inflation rates.
The clamour by folk whose standard of living is being badly affected by consumer inflation may see surprising future rises in interest rates.
Also both inflation and rate rises may lead to some falling appetite for descretionary consumer purchases such as the products of KMD Brands.
Nevertheless, the sounds from the company are positive, at least as far as the last quarter is concerned.
The company is using up cash quickly and this will constrain it somewhat if it doesn’t raise more debt or equity.
Summary
KMD Brands trumpeted its 4Q22 performance but the Group must be looked at over the whole trading period.
This analysis shows clearly some worrying signs such as the very large recast operating cash flow deficit and falling profitability.
Interest bearing debt has fallen and lease liabilities have risen.
A recent Yahoo Finance article, Investors in KMD Brands (NZSE:KMD) have unfortunately lost 49% over the last three years, has drawn attention to what a poor investment the company has been over the last few years.
It references a 67% fall in three years in the share price and a 35% fall in the last year alone.
Government grants, which provided $9.9m in FY22 will either end or be vastly reduced in FY23.
Where would the share price be without the large FY22 dividends?
There was around $70.8m in cash & cash equivalents at balance date and this is less than the change of cash balance over FY22 which was $76.3m. The company is hoping for more normal trading and also for its expansion to improve its finances.
The company’s annual report devotes large sections to its sustainability policies, climate change programme, emissions targets, B-Corp status and various other modern day politically-oriented feel good activities but precious little on how they are going to resurrect the share price.
This is typical of quite a few New Zealand companies.


